Active Intelligence Monitoring (AIM) gives our partners an overview of their customers' call quality. Behind the scenes, Cytracom is measuring billions of call metrics. Get a quick peak at overall call quality, or drill down into which extension might be experiencing an issue.
The best part is, the partner may be able to detect an anomaly before a customer even knows theres problem and proactively correct it. Jump to different sections of this AIM article by clicking on the sections below.
Quick Links in This Article:
- Overview
- Alerts Module
- Customer List
- Customer Detail
- Real-Time Overview
- Customer Alert Module
- Customer Report
- Call Volume Timeline
- Call Quality Summary
- Worst Performing Devices
- Voice Continuity Events History
- Call Quality - Score Frequency
- Call Quality - Rating by Hour
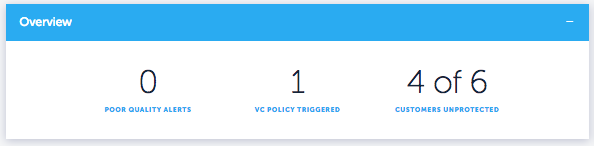
From the partner portal, navigate to the Active Intelligence widget, and click EXPLORE. This displays a high level view of all of your customers. The Overview widget denotes if there are any poor quality alerts currently detected by AIM. The customer may or may not be aware of a quality issue at this point. AIM is sifting through large amounts of data to detect any anomalies that may effect call quality.
If the devices go offline, a Voice Continuity (VC) Policy can be triggered. In the Overview widget, it will give a quantity of total triggered VC Policies across all of your customers.
Finally, in the overview widget, it lets you know how many of your customers are unprotected by a VC Policy. It is highly recommended that those unprotected customers have VC Policies created. Click here to learn how to do this.
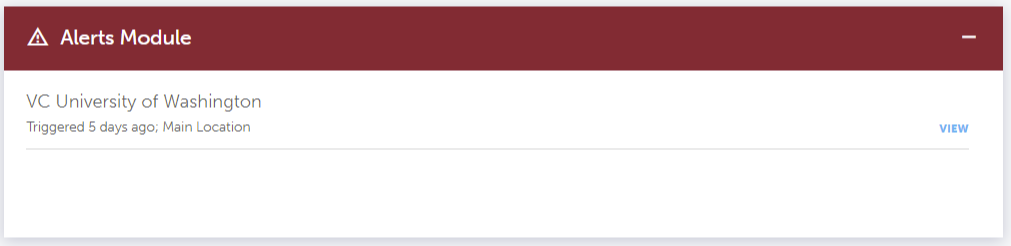
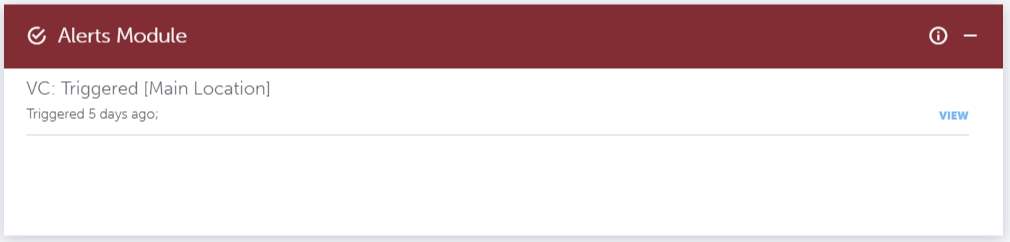
Any active alerts on a customer will be listed here. Click on VIEW on the same line as the customer, and you will see more details of that alert.
This is a complete list of all active customers for a partner. This list can be sorted by clicking on each column heading at the top of the list.
- Health Check for each customer will let you know the status of their Cytracom account based on the previous 60 minutes of call data.
- Healthy: 95% or better good call quality and no triggered VC Policies
- Degraded: 90-94% good call quality and no triggered VC Policies
- Failing: Below 90% good call quality or at least one triggered VC Policy
- No Data: Not enough data has been collected to provide an accurate health check
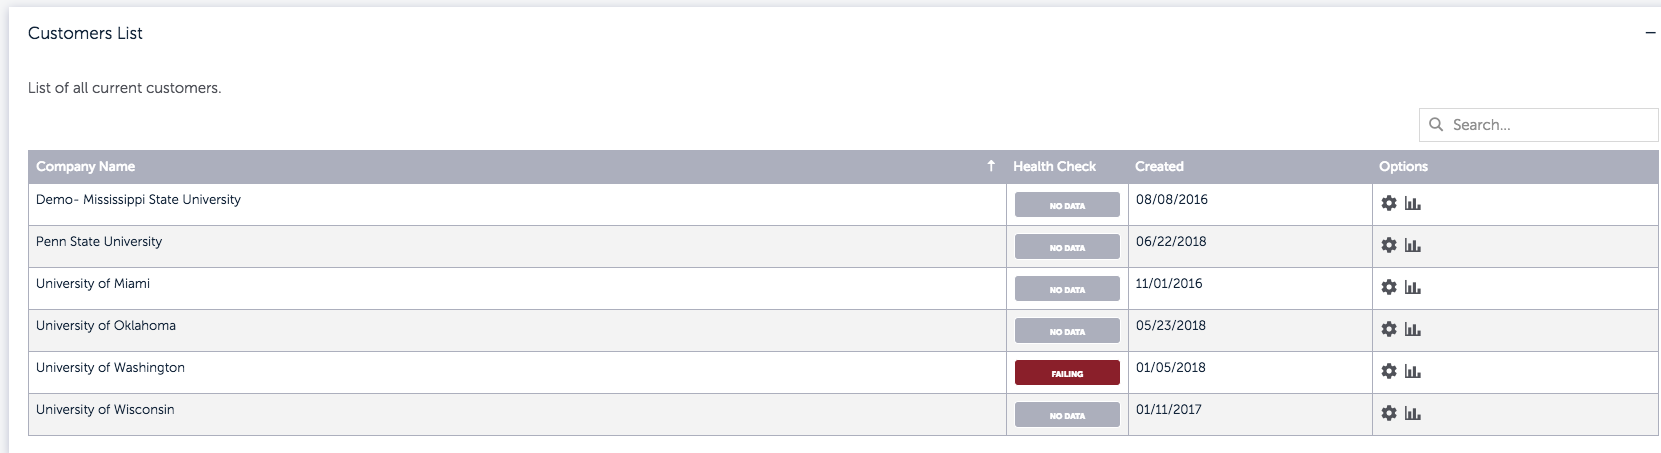
Within the Customer List, by clicking on the settings icon of a customer, you will be redirected to their PBX in the Cytracom Portal. If you would like to drill down into more call quality data, click on the graph icon. This will bring you to that customer's detail page of their call data and allow you to filter for a closer look. The examples that follow will show you what will appear if you click on the graph icon.
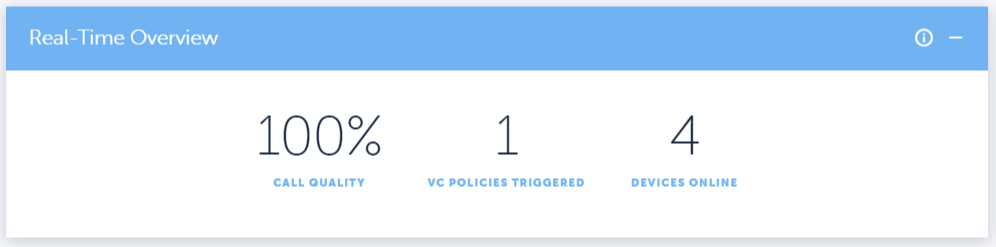
Customer Detail for a Specific Customer
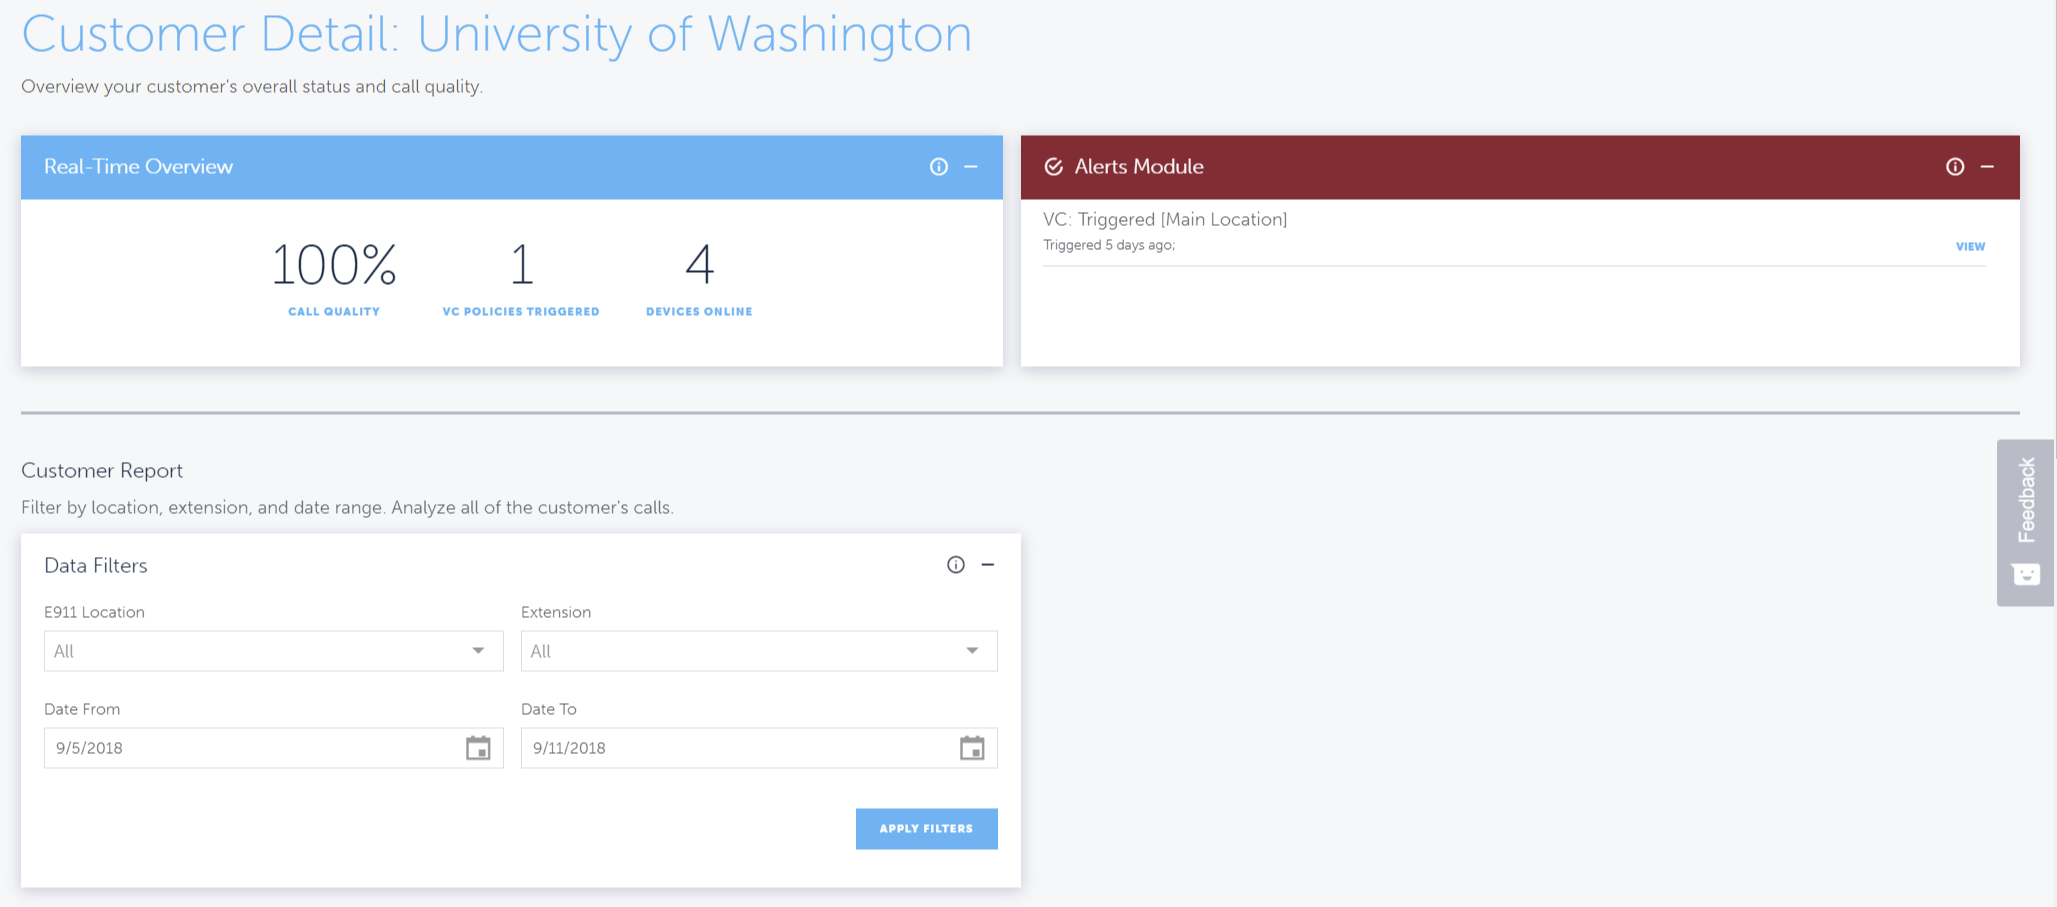
For this particular customer, you will see how many VC Policies are triggered and the number of devices online. If no policies are triggered, it will display zero.
This widget will notify you of events that may require your attention for this customer.
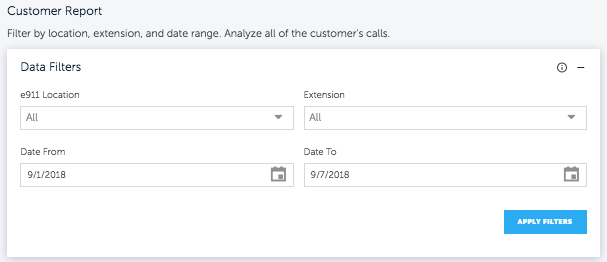
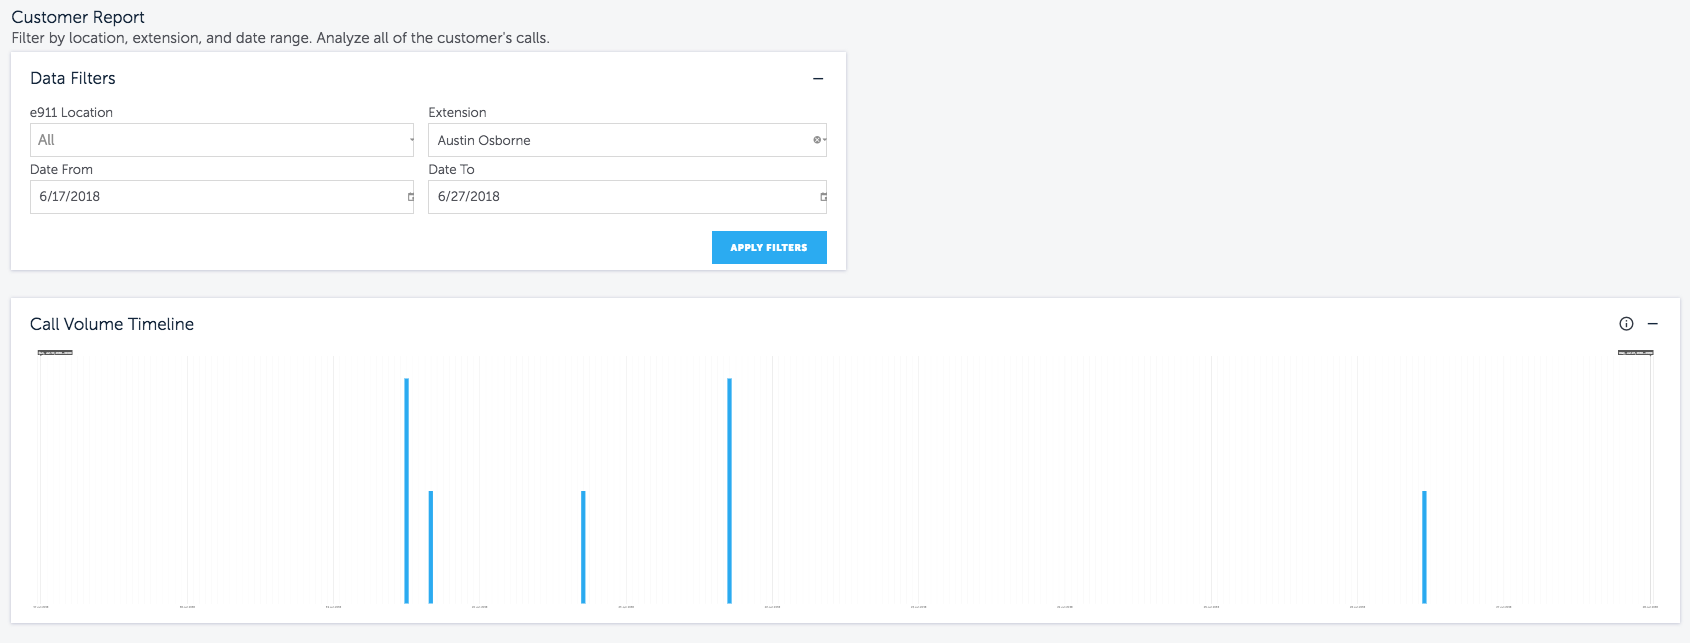
Filter by location, extension, and date range. Analyze all of the customer calls. These filters will determine the data shown on the Call Volume Timeline below this in the portal.
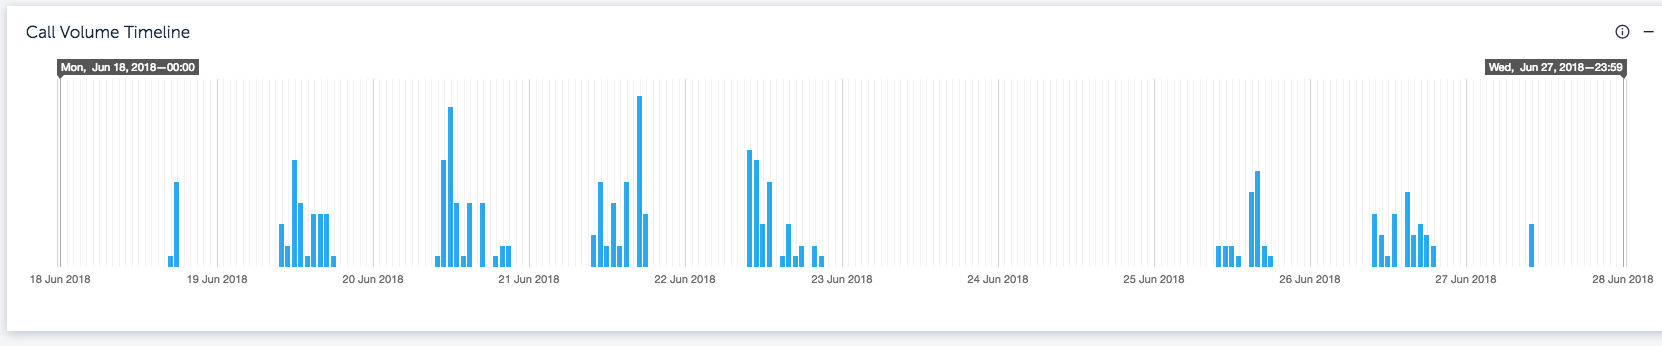
- Displays the total number of call legs in each hour on that account. This is not the number of individual calls. Each call may consist of numerous legs. A single leg call may be an extension checking their voicemail. Legs are added to a call as it goes to a PBX and connects to the directed devices
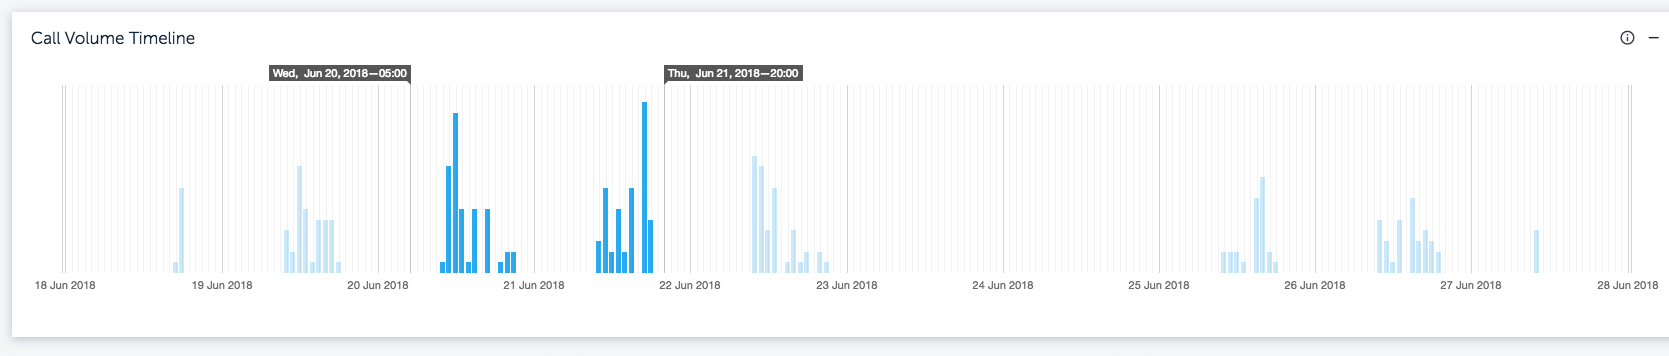
- If you would like to expand or contract the data in these widgets, slide the flags along the timeline to look at desired timeframes. In this example we have constrained the timeframe between July 20th and July 22nd.
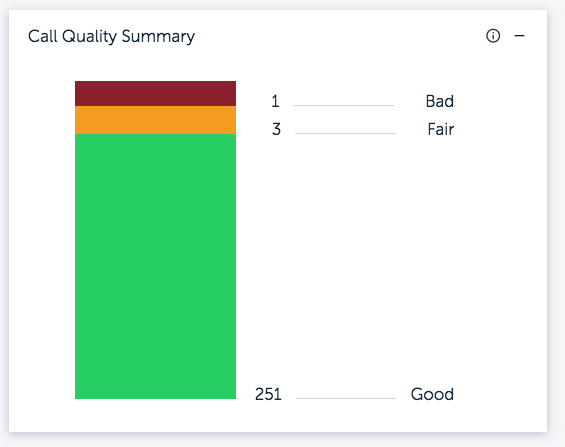
This graph shows the count of each call based on its call quality (MOS):
- Good (Green): 4.3 - 4.5 MOS
- Fair (Yellow): 3.9 - 4.2 MOS
- Bad (Red): 1.0 - 3.8 MOS
The number of calls in each range is displayed by the rating. In the example below, one call had bad quality, three had fair quality, and 251 calls had good quality.
* Please note the scores represented are derived from Cytracom to the endpoint only.
This widget drills down by device in an account. Any device that has less than 100% call quality over the selected date range will be populated here. Take into account that even though AIM detected less than 100% call quality, it may or may not have been noticeable by the end user.
Hover over the bar to see the call quality percentage for that extension. For example, if it shows 85%, that means 85% of the calls on that extension were good or fair.
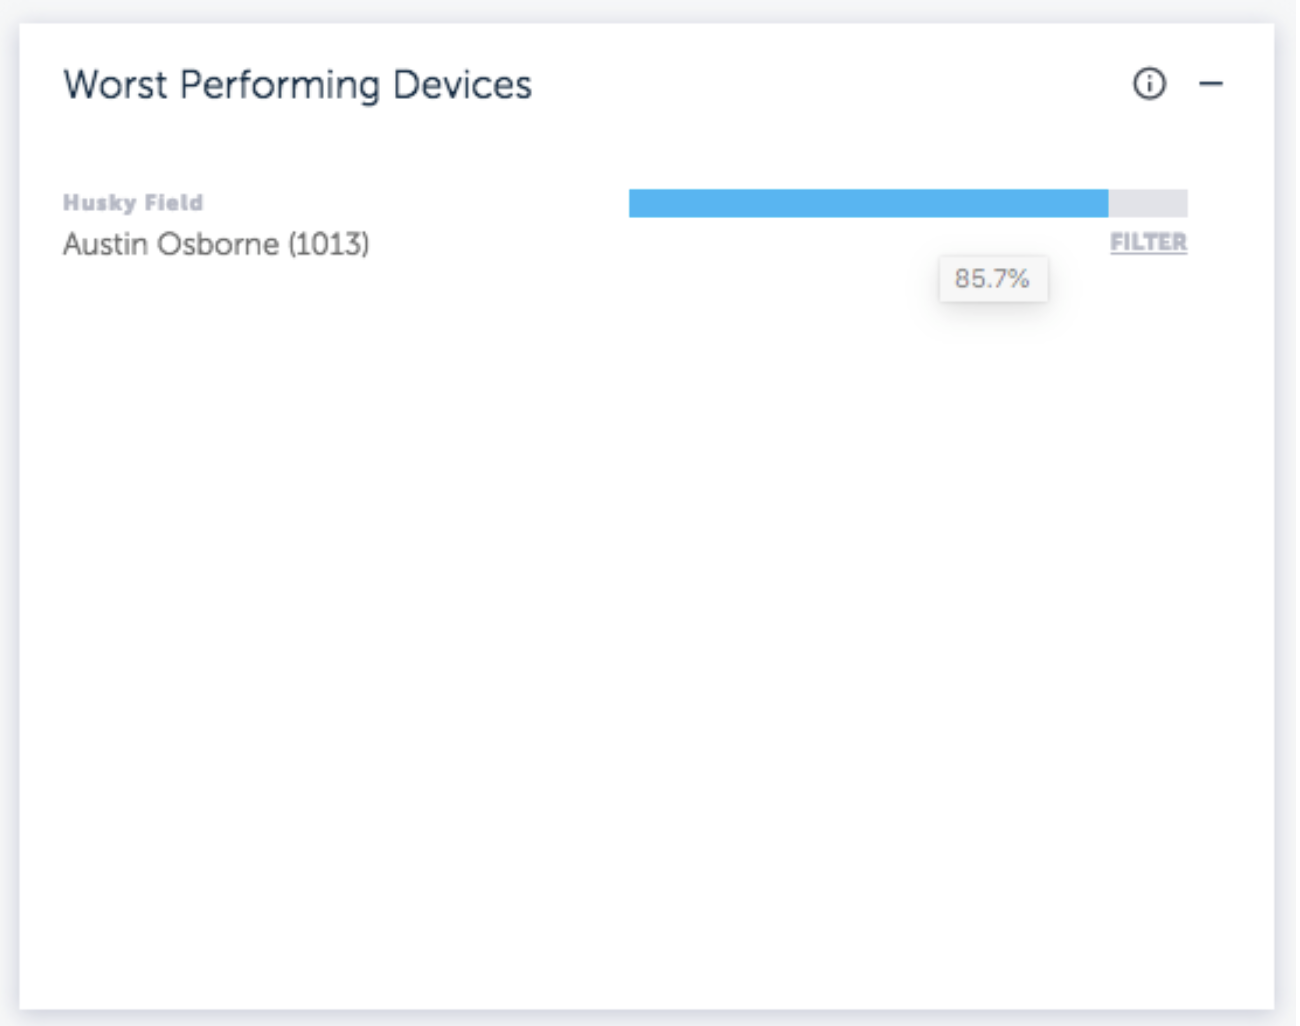
To learn more, click on the FILTER link under the bar, and it will change the Customer Report Data Filter. Now, data shown in all widgets will only reflect calls from the selected extension.
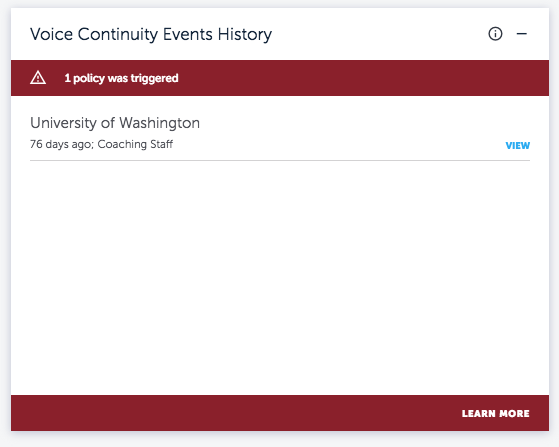
Voice Continuity Events History
Any policies triggered between the flags on the Call Volume Timeline will appear here with how many days ago it triggered. Click on VIEW next to a policy to return to the PBX and view the VC Policy or make any changes.
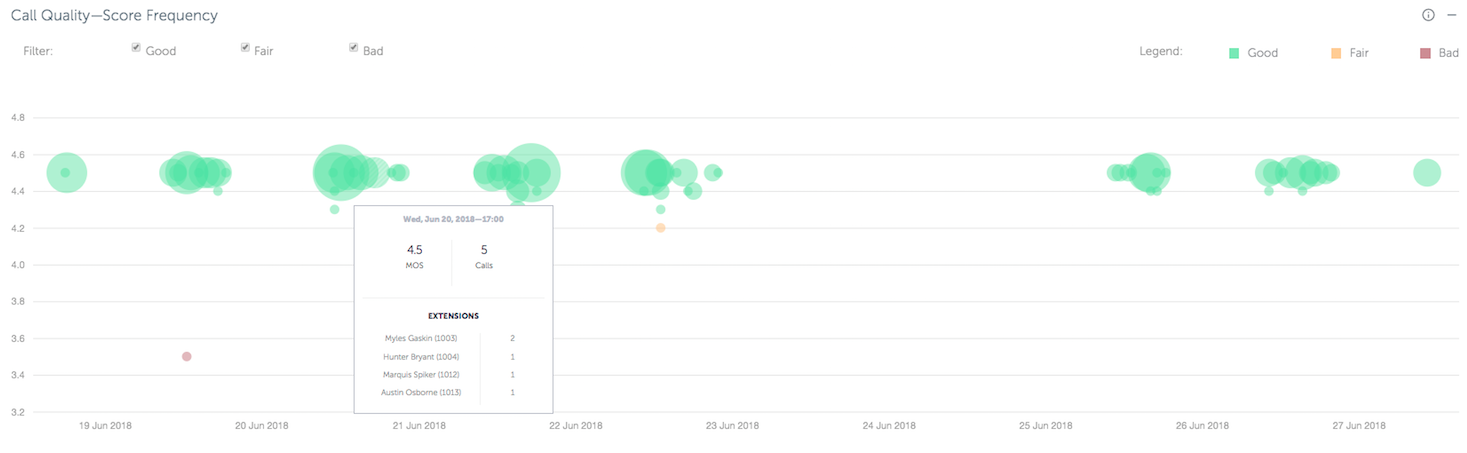
Call Quality - Score Frequency
This chart shows how many individual calls on the account have a given MOS score at a given hour. The larger the bubble, the more calls within that hour with that given MOS score. Hover over any bubble for more details:
- Date
- Hour
- Number of Calls
- MOS score
Click on any bubble to view all of the extensions within that hour at that score as well. You can also filter by unchecking or checking the Good, Fair, and Bad options at the top left of the chart.
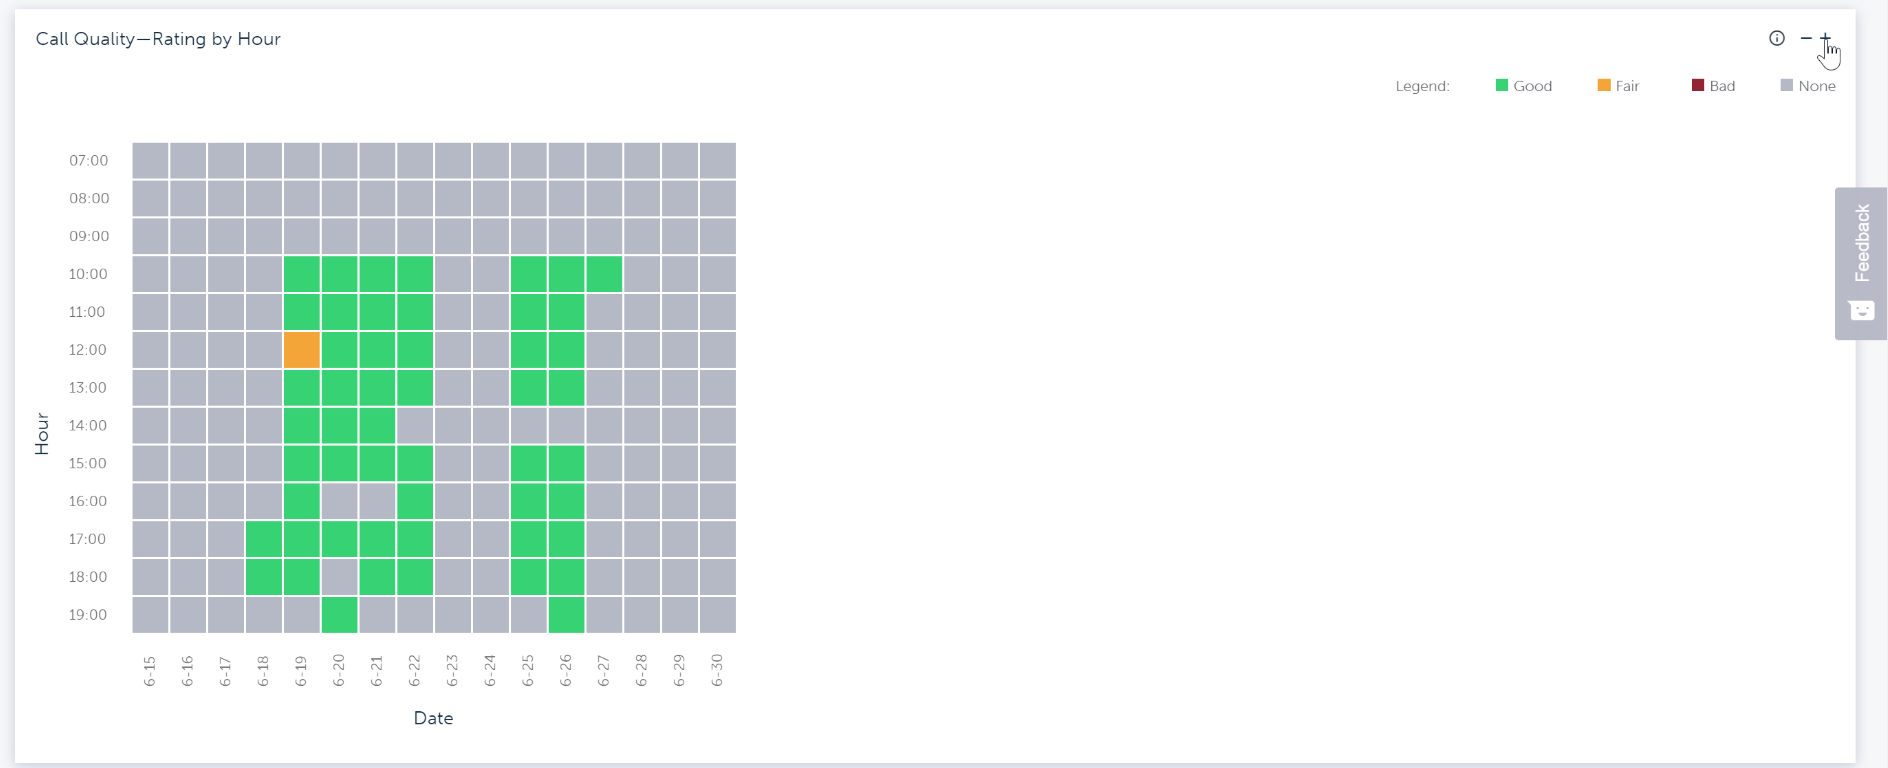
The chart below shows the average of all call quality within that hour. By setting filters in the Data Filter widget or by sliding the flags on the Call Volume Timeline, this will determine what data is populated in the Call Quality - Rating by Hour. Each square represents all call quality within that hour. Hover over any square to get more detailed information. You will see the date, hour, percentage of good or fair calls over the total calls. In the example below, On June 19th at 12:00pm, 90% call quality is shown. Nine out of 10 of the calls were good or fair in quality. One call had a MOS score between 1.0 - 3.8, which is bad. All other calls in the chart were 100% in call quality.
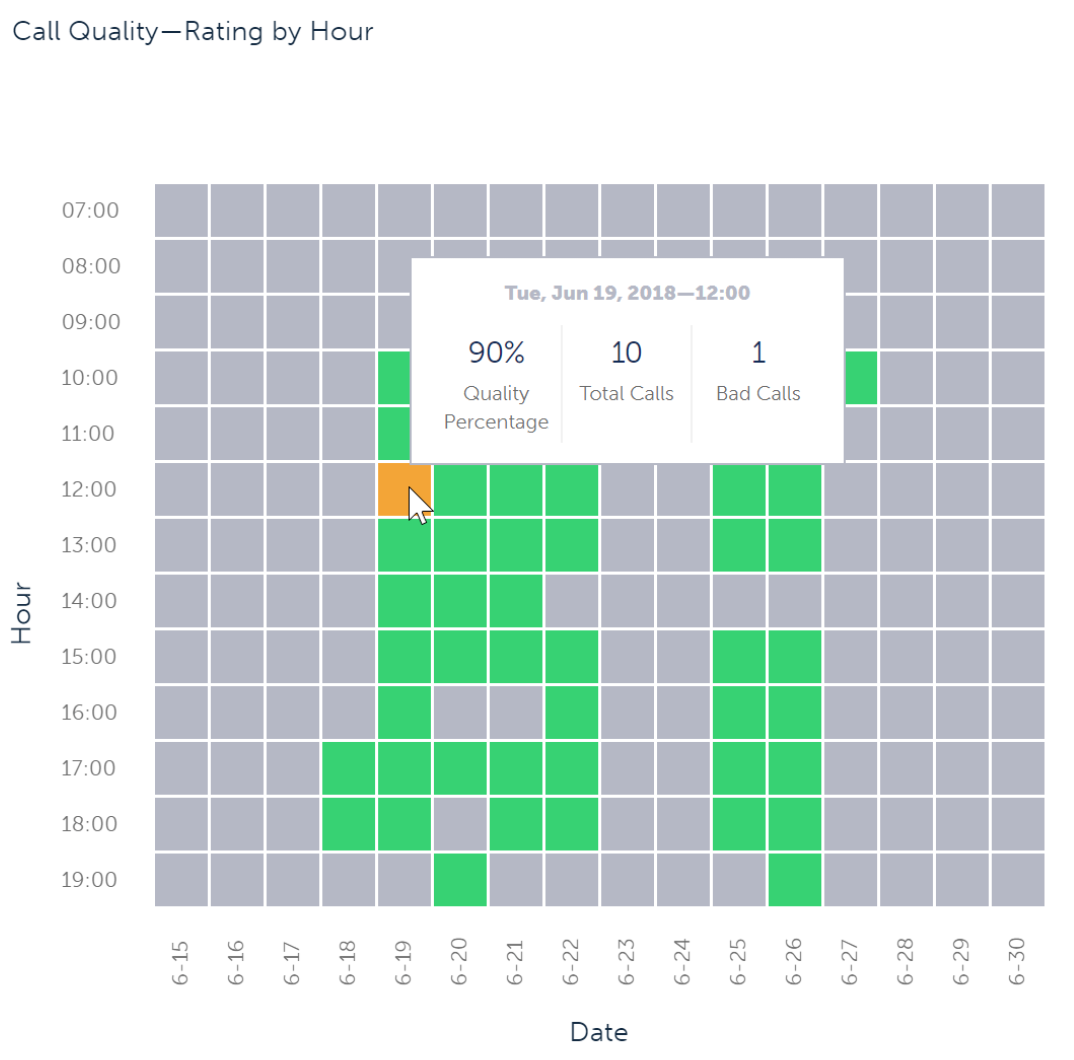
The percentage is based on the number of acceptable (good or fair) calls within that hour compared to the total number of calls within that hour.
For a given percentage, the following scale is used:
- Green: 95-100%
- Yellow: 90-94%
- Red: Below 90%
- Grey: No data
By default, normal business hours are displayed in a twelve hour block. Click on the + in the upper right hand corner to display a twenty-four hour block.